For years now, residents and elected officials alike have expressed concern over the affordability of housing in Orange County and the Triangle. Durham’s “Pennies for Housing” and Chapel Hill’s recent “Affordable Housing Bond” attest to the central role housing affordability has played in civic discourse in our area. Moreover, research suggests that the cost of an area’s housing is among the most prominent variables that factor into people’s decisions on where settle.
Which is why it’s nice to see articles that help us make investment decisions. Take a recent one by Derrick Miller published on the SmartAsset site. Miller uses the Department of Housing and Urban Development (HUD)’s definition of “housing cost-burdened”—i.e., when people spend more than 30% of their income on housing—to estimate the percentage of folks in various U.S. cities who are burdened by their housing costs. His calculations reveal that Newark, NJ is the nation’s “most severely housing cost-burdened” city in the U.S. and that Cary, NC is the least housing cost-burdened city.
Miller says, “altogether nearly 48% of households in Newark spend at least 30% of their income on housing.” On the other hand, he notes that with less than 15% of Cary homeowners spending more than 30% of their income on housing, “Cary residents are some of the most financially flexible in the nation.”
But is Miller telling the whole story? Would anyone seriously argue that a $300,000 house located 10 miles from the nearest grocery store cost homeowners the same as a $300,000 house located within ½ mile walking distance of a grocery store, offices, shops, and restaurants? In fact, when we factor in households’ transportation costs, a different cost picture emerges.
To account for households’ transportation costs, I entered Newark, NJ and Cary, NC into the Housing and Transportation (H + T) Affordability Index—a tool developed by the Center for Neighborhood Technology (CNT) that includes both the cost of housing AND the cost of transportation to more closely reflect the affordability of places.
In direct contrast with Miller’s analysis, the H + T Index shows that the typical Newark homeowner spends significantly less of her income on housing and transportation (33%) than does the average Cary homeowner (51%). Miller’s claim that “Cary residents are some of the most financially flexible in the nation” begins to look suspect.
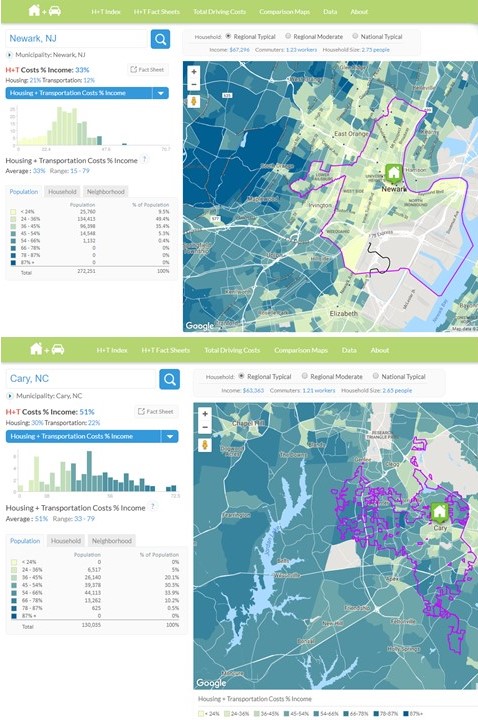
A screenshot of Center for Neighborhood Technology’s Housing + Transportation Affordability Index, which shows the distribution of households according to the percentage of their income spent on housing and transportation.
What’s behind these cities’ transportation costs? Let’s consider these facts from the 2016 American Community Survey:
In Newark, NJ, more than a quarter of all households (26.4%) don’t have a vehicle, and only 35.4% of households own two or more vehicles. Also, 26.5% of workers in Newark take public transit and 8% walk to work. In Cary, only 1.3% of households do not have a vehicle, and nearly 7 in 10 households (67.8%) own two or more vehicles. It’s no surprise, then, that a paltry 0.81% of Cary workers take public transit to work and only 1.1% walk.
Much of the difference in household transportation costs between Newark and Cary resides in the town’s vehicle ownership rates. According to a yearly analysis by the AAA called Your Driving Costs, owning and operating a new vehicle in 2017 costs a driver an average $706 each month. If folks decide to own a new SUV or truck, the average monthly costs rise to between $790 and $850. With 67.8% of Cary householders owning two or more vehicles, one can see why living in Cary may not prove as financially viable as housing costs alone would suggest.
Bringing this discussion closer to home, I investigated Carrboro, NC’s housing and transportation cost profile. Having lived in this town for the past decade, we’ve been inundated with arguments about how living in Carrboro is so much more expensive than living in Cary. And so, I entered both Carrboro and Cary into the H + T Index tool. It turns out that contrary to popular myth, your average homeowner in Carrboro spends slightly less of her income on housing and transportation (49%) than does the typical Cary homeowner (51%).
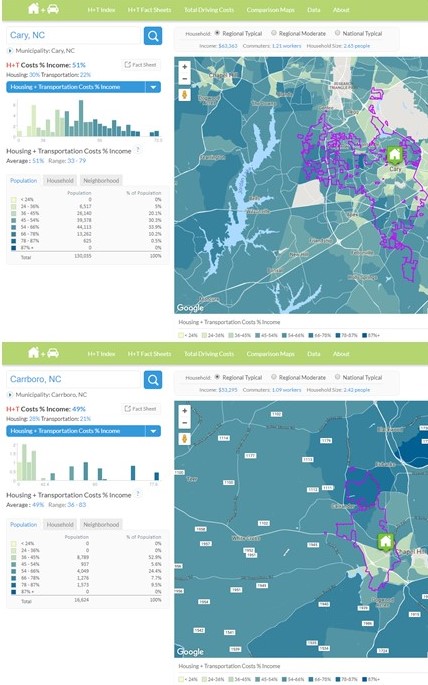
A screenshot of Center for Neighborhood Technology’s Housing + Transportation Affordability Index, which shows the distribution of households according to the percentage of their income spent on housing and transportation.
Again, much of the disparity between to two towns’ transportation costs comes down to their differences in vehicle ownership. About 7.3% of households in Carrboro have no vehicles, whereas only 1.3% of households in Cary are without vehicles. Further, in Carrboro less than half (48.3%) own two or more vehicles, compared with Cary’s nearly 70% two or more vehicle households.
As you can see, cars are downright expensive. Towns and cities differ according to whether residents require one or more of them to fully participate in civic life. It’s therefore up to local leaders and developers to create places that grant people the freedom to choose how they get around their towns and cities. Freedom in settlement, freedom in transportation. What’s more American than that?
Issues:
Comments
I expect you are correct which is another jeapody to the "tiny homes" movement. Cost per square foot of a tiny home is not much less than a ~1200 sq foot house.
Cost per square foot is something people calculate intutively when they compare housing and transit costs including time rarely factor until a certain threshold is crossed.
Millenials are deserting the cities (as their foreparents did) because they can get more house (square foot per person) as their family grows. Technology reduces the need to be at a certain location and more and more are able to work from home entirely. Online shopping further reduces the dependancy on nearby retail. The real limiting factor is the availability of broadband which is beginning to afffect property resale values.
I think you made your point about Newark versus Cary quite well.
Bringing this discussion closer to home, I investigated Carrboro, NC’s housing and transportation cost profile. Having lived in this town for the past decade, we’ve been inundated with arguments about how living in Carrboro is so much more expensive than living in Cary. And so, I entered both Carrboro and Cary into the H + T Index tool. It turns out that contrary to popular myth, your average homeowner in Carrboro spends slightly less of her income on housing and transportation (49%) than does the typical Cary homeowner (51%).
I was responding mostly to this paragraph where you specifically seem to be trying to make the point that Carrboro is cheaper than Cary.
Interesting post though - thanks for writing it.
point?
Cary, North Carolina,sales tax rate is 6.75%. Income tax is 5.75%. The income per capita is $41,785, which includes all adults and children. The median household income is $91,481.
Carrboro, North Carolina,sales tax rate is 7.50%. Income tax is 5.75%. The income per capita is $36,451, which includes all adults and children. The median household income is $51,310.
Newark, New Jersey,sales tax rate is 7.00%. Income tax is 5.53%. The income per capita is $16,828, which includes all adults and children. The median household income is $34,012.
Any possible correlation to affordability? Interesting point, maybe?

I like the H+T tool you pointed out and I agree that transportation costs are typically underestimated. The total costs of driving on that site seem too high to me, though. Perhaps they're skewed towards assuming more people buy new cars than people actually do - not sure.
Miller's analysis seems off but comparing Cary and Carrboro like you did seems to miss the mark too. Using the same tool, let's look at San Francisco. It turns out people pay only 41% if their income on housing and transportation - significantly less than Carrboro or Cary! Does that mean it's cheaper to live in SF? Of course not - the cost per square foot is astronomical in SF compared to Carrboro.
I think you'll find a non-negligible difference in cost per square foot between Carrboro and Cary which the costs as a percent of income calculation ignore.